
Overview
Key Features
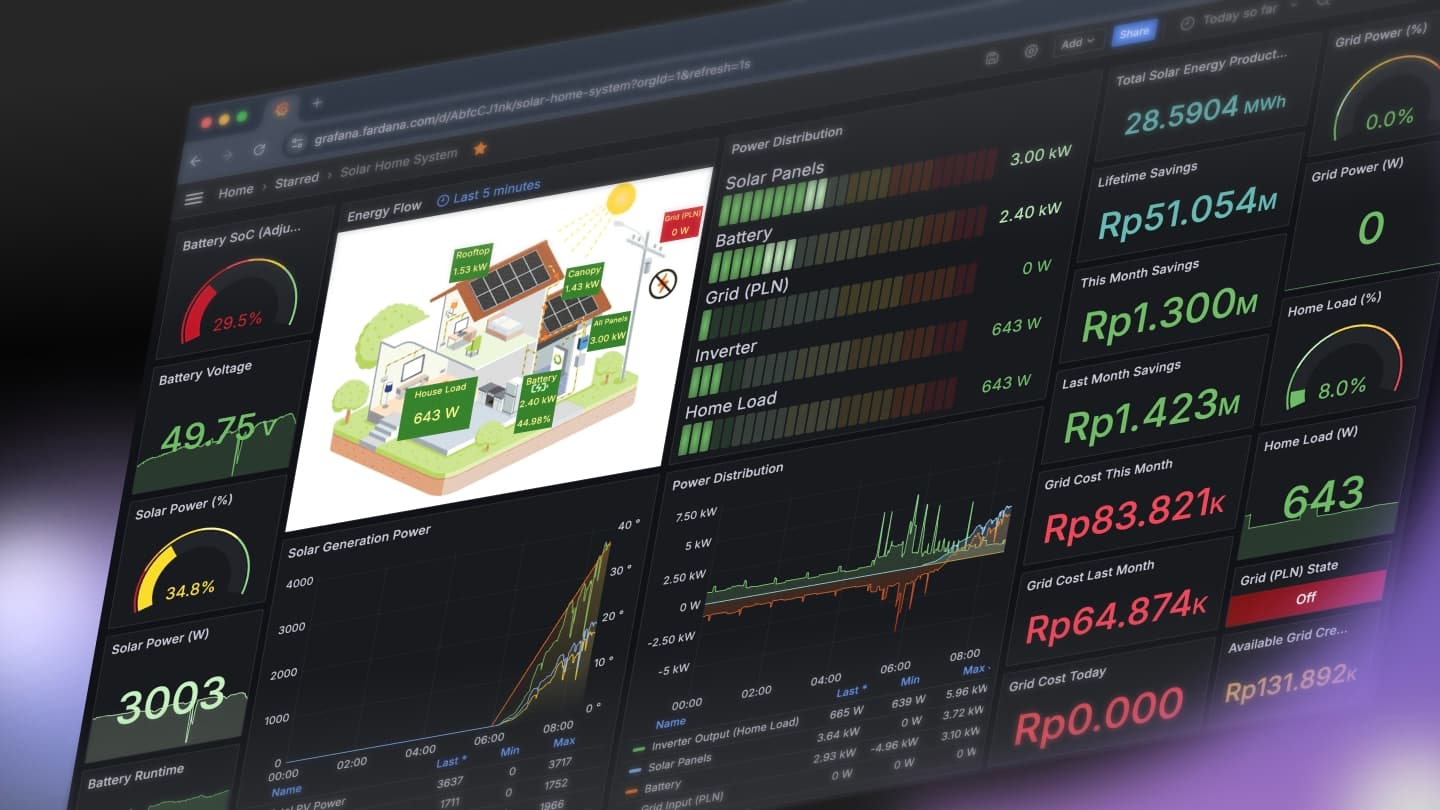
- Real-Time Monitoring and Analytics: Leverage Grafana's powerful visualization capabilities combined with Node-RED's real-time data handling and Python-based acquisition layers to deliver instant insights into energy generation, consumption, and storage performance. The system enables proactive decision-making with live metrics, trend analysis, and anomaly detection.
- Highly Customizable Data Pipelines: Built with modular Node-RED flows and extensible Python scripts, the system allows full flexibility in integrating diverse energy sources, inverters, battery management systems, and environmental sensors. Users can easily adapt, extend, or reconfigure the data pipelines without major architectural changes.
- Scalable and Distributed Architecture: The backend is based on InfluxDB designed to scale horizontally, supporting local microgrids to multi-site solar deployments. Distributed data nodes feed into centralized Grafana dashboards, ensuring low-latency, resilient monitoring even across geographically separated energy assets.
- User-Centric, Adaptive Dashboard Design: The Grafana dashboard is developed with a focus on user-specific needs: dynamic panel configurations, context-aware alerts, and role-based access ensure that operators, homeowners, or maintenance teams each get tailored, actionable visualizations, boosting operational efficiency and user satisfaction.
Technologies Used
- Grafana: Utilized as the main front-end platform to create highly customizable and dynamic dashboards, offering real-time visual insights, trend analysis, and alerting based on user-defined thresholds.
- Node-RED: Functions as the primary orchestration layer for connecting hardware devices, processing telemetry data, and managing communication flows.
- Custom Python Scripts: Custom-developed modules for specialized data acquisition, device protocol handling (e.g., RS-485 communication), and preprocessing before visualization.
- InfluxDB: Deployed as the time-series database backend, optimized for high-frequency energy telemetry storage, efficient historical querying, and seamless integration with Grafana for historical trend analysis and predictive modeling.
Challenges and Learnings
- Integration Complexity: Bridging different communication protocols (e.g., RS-485, Modbus, vendor-specific APIs) required designing robust and fault-tolerant acquisition scripts.
- Real-Time Data Consistency: Ensuring low-latency updates without data loss demanded optimization at both Node-RED and Python layers, particularly around asynchronous data handling and buffer management.
- Scalability and Flexibility: Initial designs were rigid; iterative improvements led to a more modular architecture that allows seamless addition of new sensors, batteries, or inverter models.
- Security and Reliability: Implementing secure data channels and ensuring system uptime (even during partial hardware or network failures) became critical learnings for production-grade deployment.
Outcome
Live Demo
Need a similar dashboard?
Book a Consultancy