Jakarta, Indonesia
Posts

From Polling to Push: Achieving Real-Time Tuya Power Monitoring

I run a home energy monitoring system built on Tuya smart plugs and a circuit breaker (MCB), feeding data through tinytuya into InfluxDB and Grafana. It worked — until I noticed something annoying: the Tuya app on my phone showed power values updating every second, while my Grafana dashboard lagged behind by over a minute. The MCB was reading 164W in the Tuya app. Grafana? Still stuck at 176W from a minute ago. For a system designed to monitor real-time power consumption, this was unacceptable. Before diving into the fix, here's what I'm working with:
  • 7 Tuya devices (smart plugs + 1 MCB circuit breaker) on the local LAN
  • tinytuya (v1.17.6) — Python library for local Tuya device communication
  • InfluxDB — time-series database for power metrics
  • Grafana — dashboard with 1-second auto-refresh
  • Mini PC running the tuyamon Python service as a systemd unit
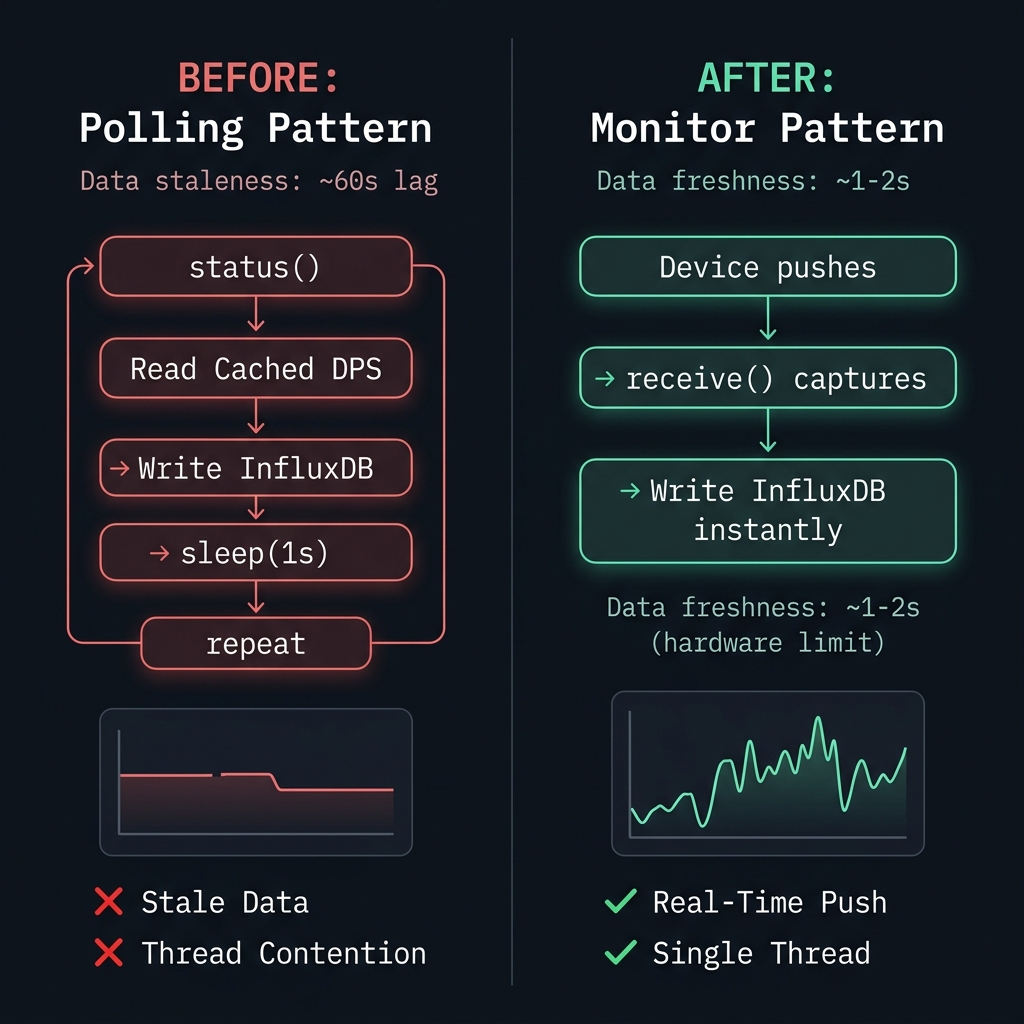
The whole pipeline was supposed to deliver 1-second resolution power data. The bottleneck wasn't InfluxDB or Grafana — it was how I was talking to the devices. My original approach was straightforward: call status() on each device every second via a persistent TCP connection, write the DPS (Data Point) values to InfluxDB.
Before vs After: Polling Pattern vs Monitor Pattern
The problem? status() reads from the device's cached DPS store — an internal buffer that the device updates at its own pace. Even sending UPDATEDPS commands to force a refresh didn't help much, because the ordering and timing created a cascade of issues. This wasn't a one-shot fix. I went through four distinct approaches before finding the right one.
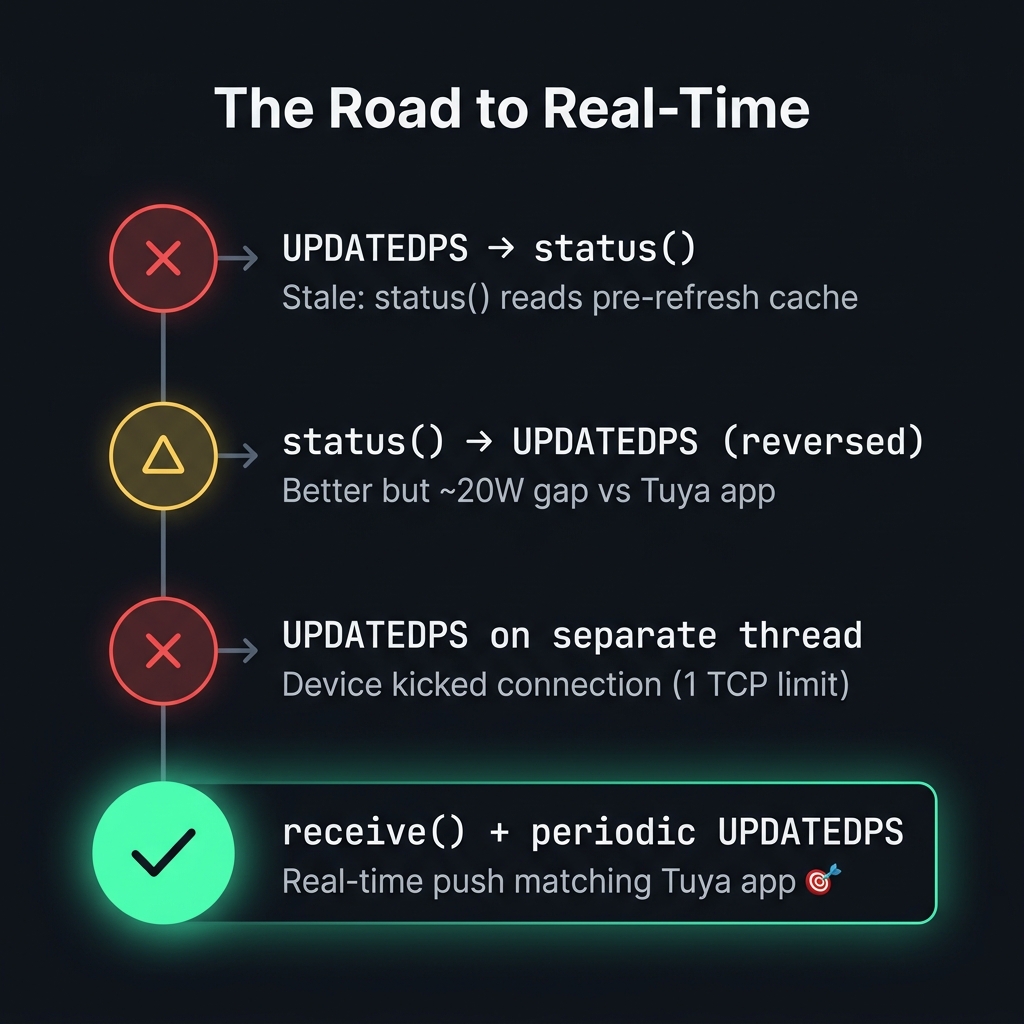
The Road to Real-Time: 4 approaches tried
The intuitive approach: send UPDATEDPS to refresh the device's cache, then immediately call status() to read the fresh values. Result: Still stale. The UPDATEDPS triggers an asynchronous refresh inside the device. By the time status() executes (milliseconds later), the cache hasn't been updated yet. You're reading yesterday's newspaper. Flip the order: read status() first (getting values refreshed by the previous cycle's UPDATEDPS), then send UPDATEDPS for the next cycle. One-cycle-delayed but theoretically fresh. Result: Better — values were updating, but there was a persistent ~20W gap compared to the Tuya app. The device's internal cache simply doesn't refresh fast enough for this pattern to match real-time. Maybe the solution was parallelism? I moved UPDATEDPS to its own thread so it wouldn't block the status polling. Result: Disaster. Tuya devices only support one TCP connection at a time. The second thread's connection kicked the first one off, causing "Device Unreachable" (905) errors and connection storms. This is where things got interesting. I ran a quick test script:
Python
d = tinytuya.OutletDevice(DEVICE_ID, IP, KEY)
d.set_version(3.5)
d.set_socketPersistent(True)

# Send UPDATEDPS to trigger push stream
d.updatedps(nowait=True)

# Listen for push data
for i in range(20):
    data = d.receive()
    if data and "dps" in data:
        power = int(data["dps"]["19"]) * 0.1
        print(f"PUSH: {power}W")
And the output was revelatory:
PUSH: 190.1W
PUSH: 190.0W
PUSH: 189.3W
PUSH: 189.9W
PUSH: 190.5W
PUSH: 191.2W
The device was pushing real-time data on its own! Every 1-2 seconds, the MCB sent fresh DPS updates over the persistent TCP socket — no polling needed. I just had to listen. This is exactly what the Tuya app does. It doesn't poll. It opens a persistent connection, sends occasional UPDATEDPS commands to keep the push stream alive, and captures whatever the device sends via receive().
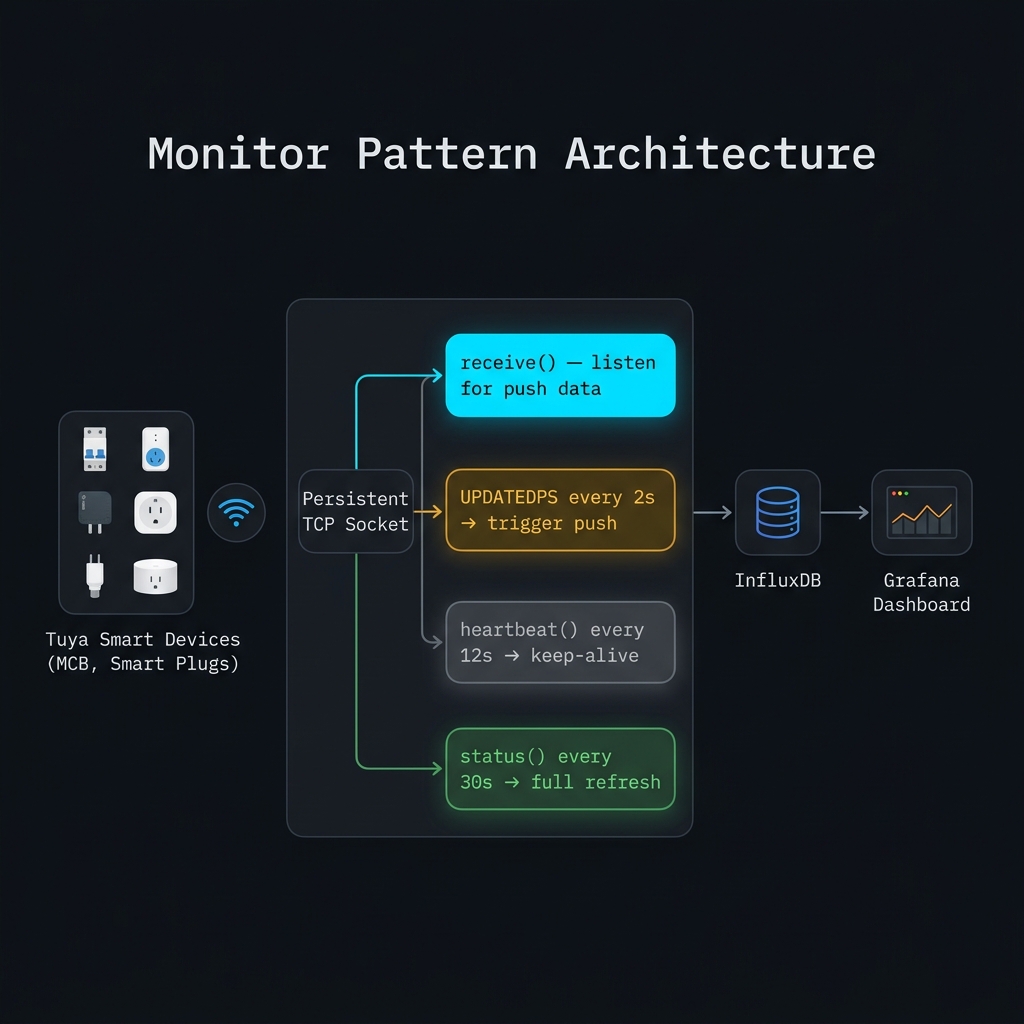
Monitor Pattern Architecture
The new poll_device() function uses a nested loop pattern: Outer loop — manages the persistent connection lifecycle. If the connection drops, it reconnects and restarts. Inner loop — the monitor loop with four timer-based actions:
Python
while not shutdown_event.is_set():
    now = time.time()

    if now >= status_time:
        # Every 30s: full status() refresh as fallback
        conn.updatedps(nowait=True)
        data = conn.status()
    elif now >= updatedps_time:
        # Every 2s: trigger device to keep pushing
        conn.updatedps(nowait=True)
        data = conn.receive()
    elif now >= heartbeat_time:
        # Every 12s: keep TCP connection alive
        data = conn.heartbeat(nowait=False)
    else:
        # Primary path: listen for push data
        data = conn.receive()

    if data and "dps" in data:
        write_dps_to_influx(device, data["dps"], dt)
The socket timeout is set to 0.5 seconds for the listen loop — short enough to cycle quickly through the timer checks, but long enough to catch incoming push data without busy-waiting. After deploying the monitor pattern:
Metric
Before
After
Data Freshness~60s lag vs Tuya app~1-2s (hardware limit)
Update Rate1/sec (but stale cache)~1-2/sec (real-time push)
Loop OverrunsFrequent (>1s iterations)Zero (event-driven)
Connection ErrorsSporadic 905/914 stormsZero in steady state
Tuya App Match❌ 20W+ gap✅ Exact match
The MCB now reads 202.9W in InfluxDB at the exact same moment the Tuya app shows 202.9W. After a few seconds of settling, the values track perfectly. What you see in Grafana is what you see in the Tuya app. 1. Tuya devices are push-capable locally. They don't just respond to queries — they proactively push DPS updates over persistent TCP connections. This is how the official app gets real-time data, and you can do it too with receive(). 2. One connection per device, no exceptions. Tuya's firmware supports exactly one TCP connection. Any concurrent access — even from another thread in the same process — will kick the existing connection. Serialize everything. 3. UPDATEDPS is a trigger, not a query. It doesn't return data directly. It tells the device "start pushing fresh readings." The actual data arrives asynchronously via receive(). 4. Socket timeout matters for the listen loop. Too long (3s) and you miss push data during the block. Too short (50ms) and you burn CPU. 0.5s is the sweet spot — fast enough to cycle through timers, slow enough to catch pushes. 5. The official tinytuya monitor.py example had the answer all along. Sometimes the solution is in the library's own examples. I just needed to understand why it worked differently from polling.
This optimization is part of my ongoing Solar Home System project, where I monitor and manage residential power consumption using a custom-built IoT stack running on an inexpensive Mini PC.
On this page